Calculators
 ToolGold lot size calculatorEnter your balance in dollars, your risk, and how far your stop is from your entry in dollars per ounce. You get the XAU/USD lot size that loses that amount at...
 ToolForex lot size calculatorEnter your balance, the percentage you will risk, your stop in pips and the pip value of one standard lot. You get the lot size that loses that amount at the...
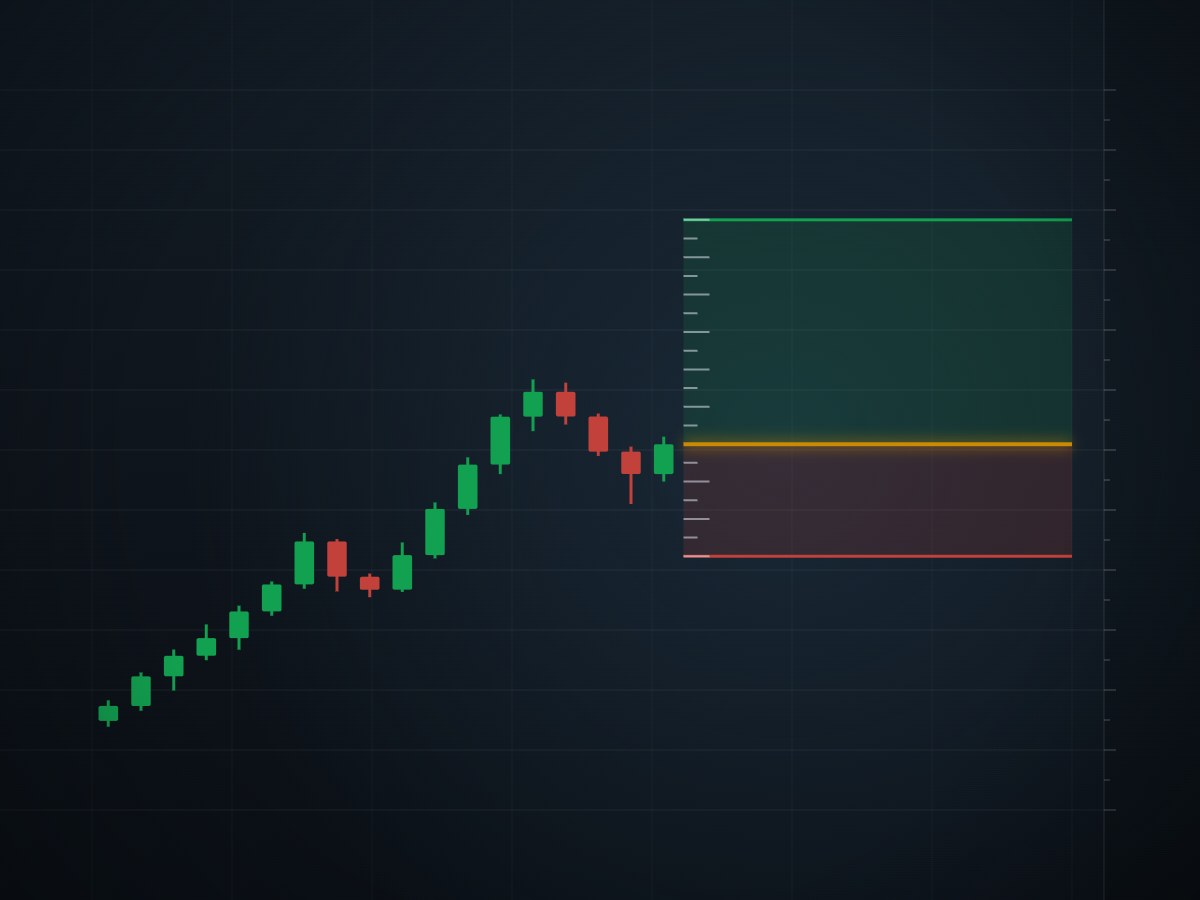 ToolForex pip calculatorPick the pip size, enter your position in lots and the rate that turns the quote currency into your account currency. You get the value of one pip in both.
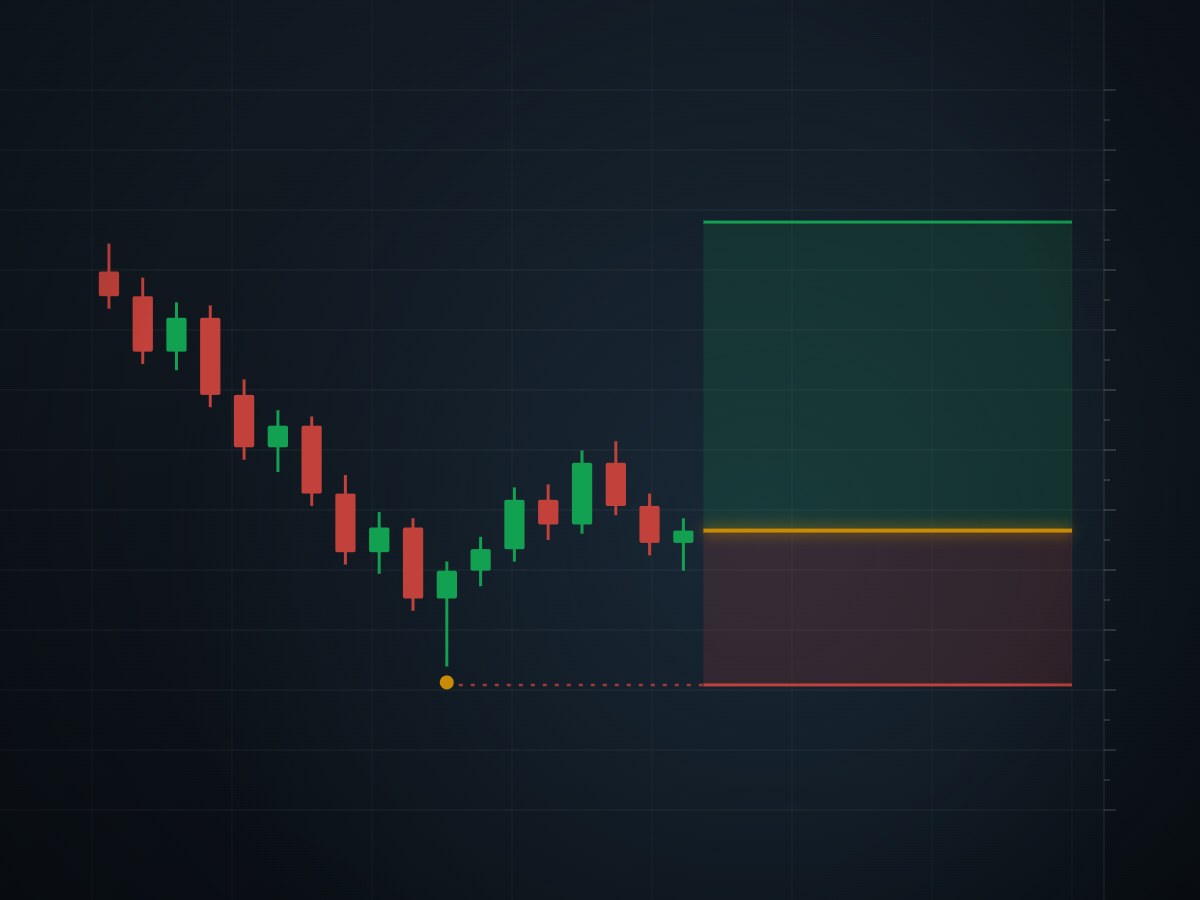 ToolPosition size calculatorEnter your account, the percentage you're prepared to lose, your entry and your stop. You get the position size that keeps a stopped-out trade at that loss, in...
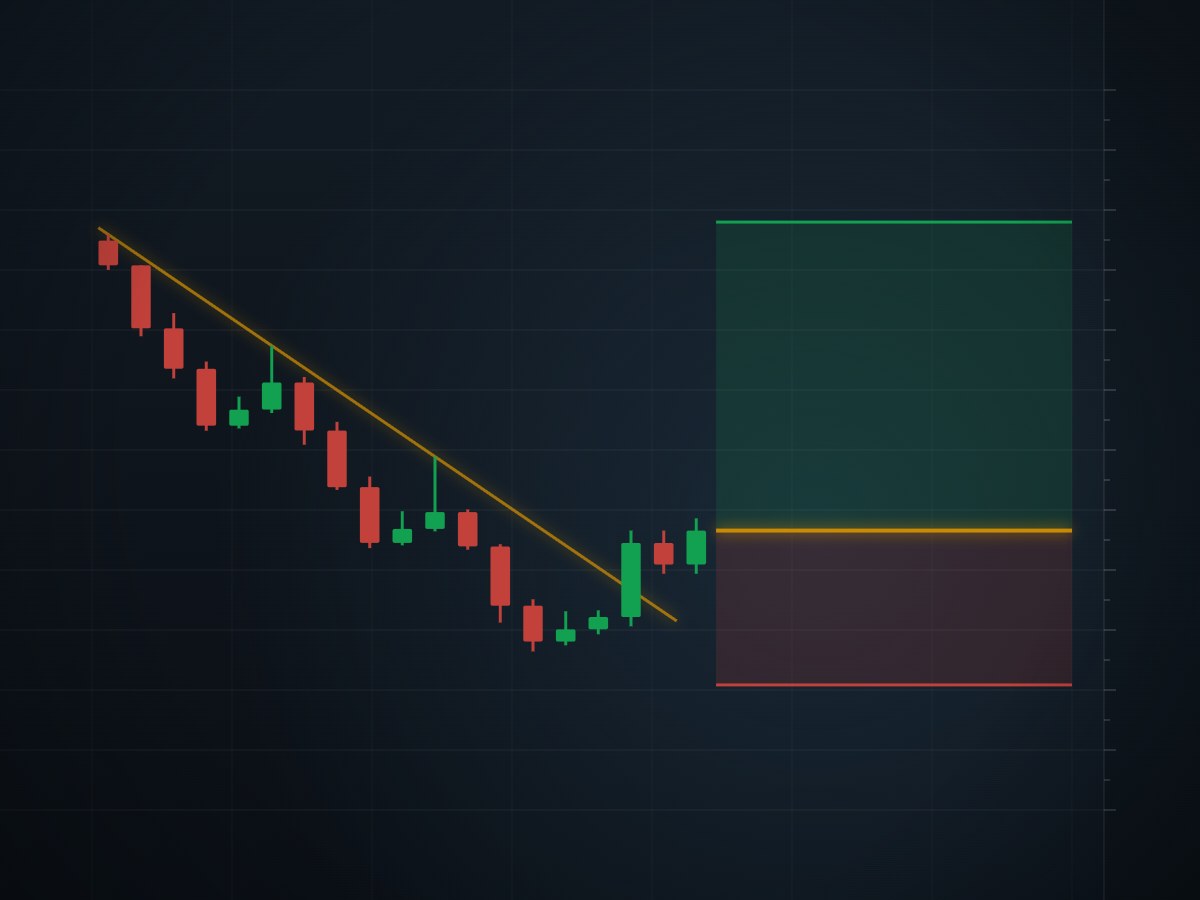
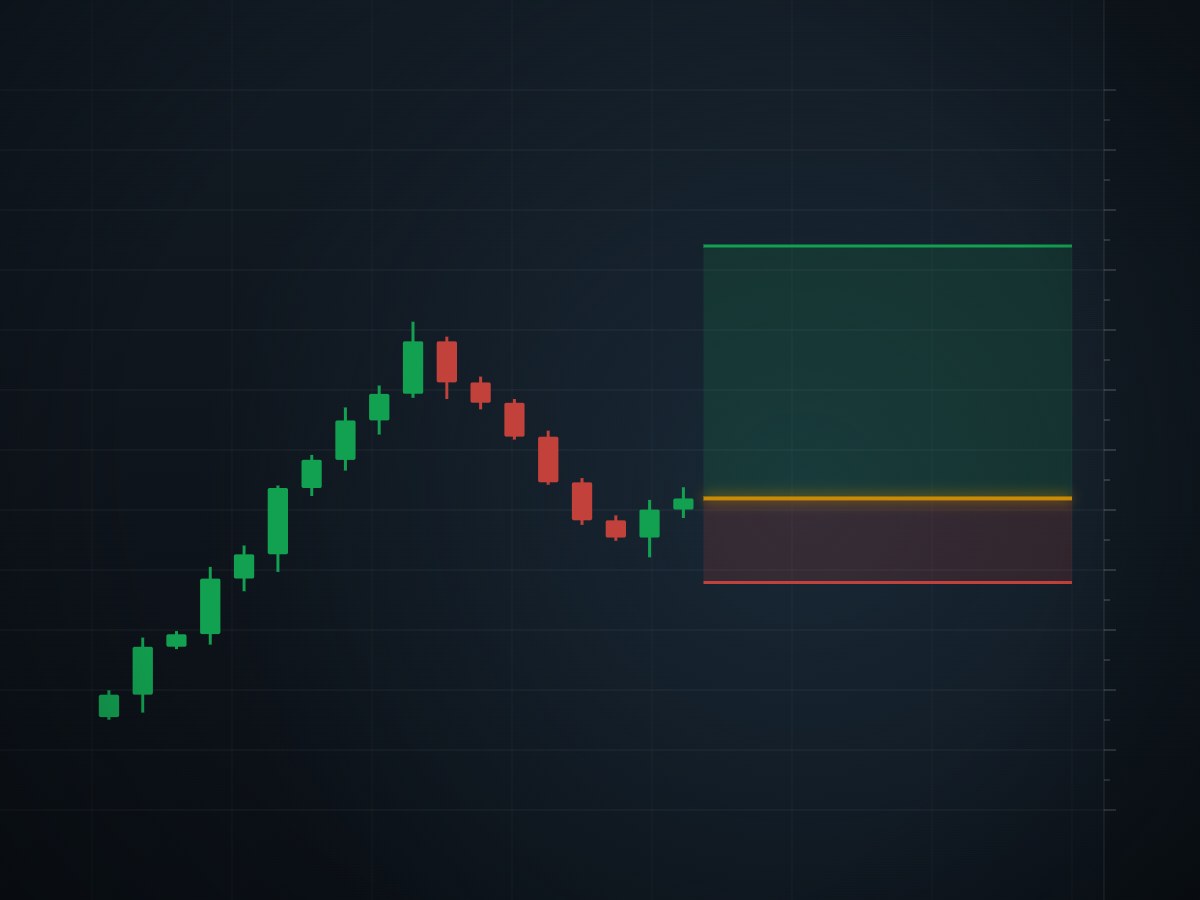 ToolRisk reward calculatorType in your entry, stop-loss and take-profit. You get the risk to reward ratio and the share of trades you would need to win just to break even, before costs.
Candlestick patterns
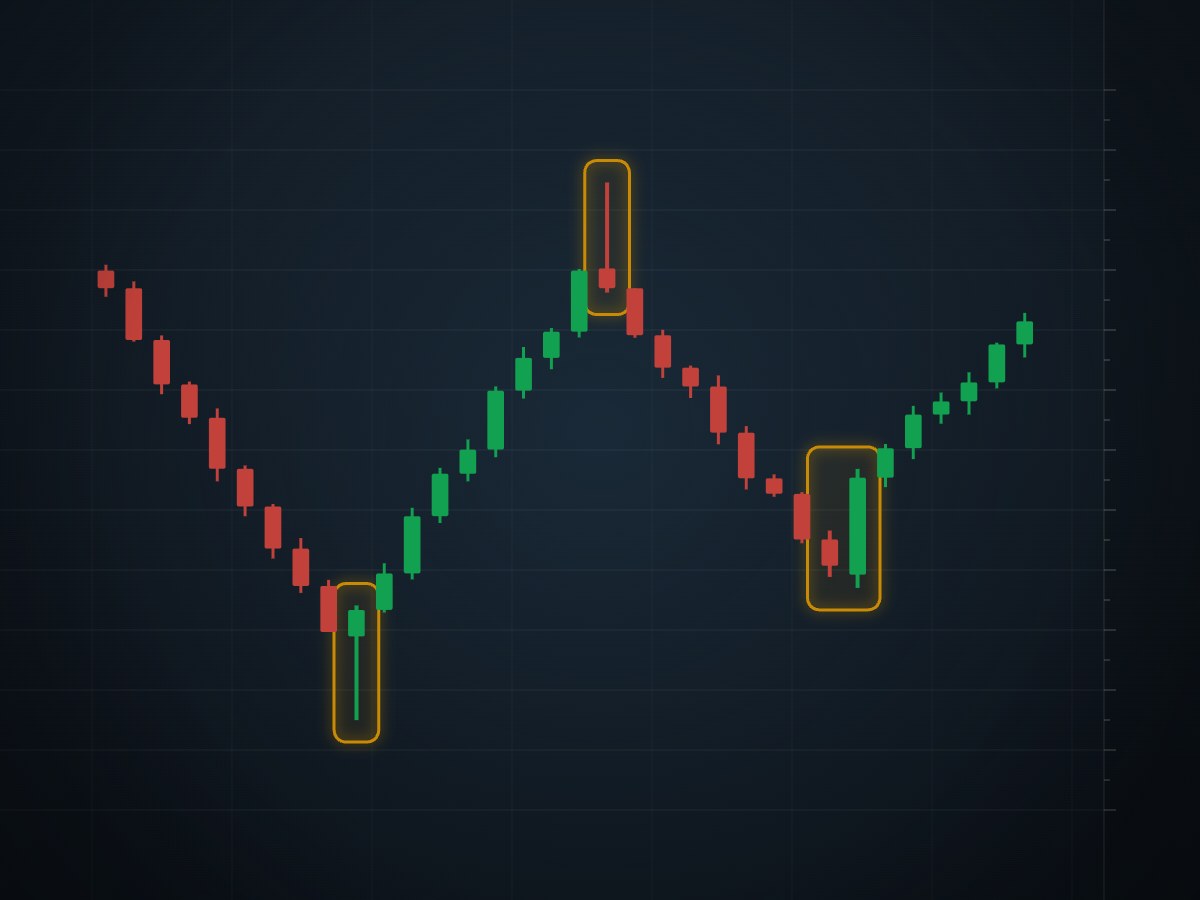 GuideCandlestick patterns, drawn with their stopsThe sixteen patterns traders ask about most, each drawn where it usually appears, with the line where it stops working. All of them fail often, so that line...
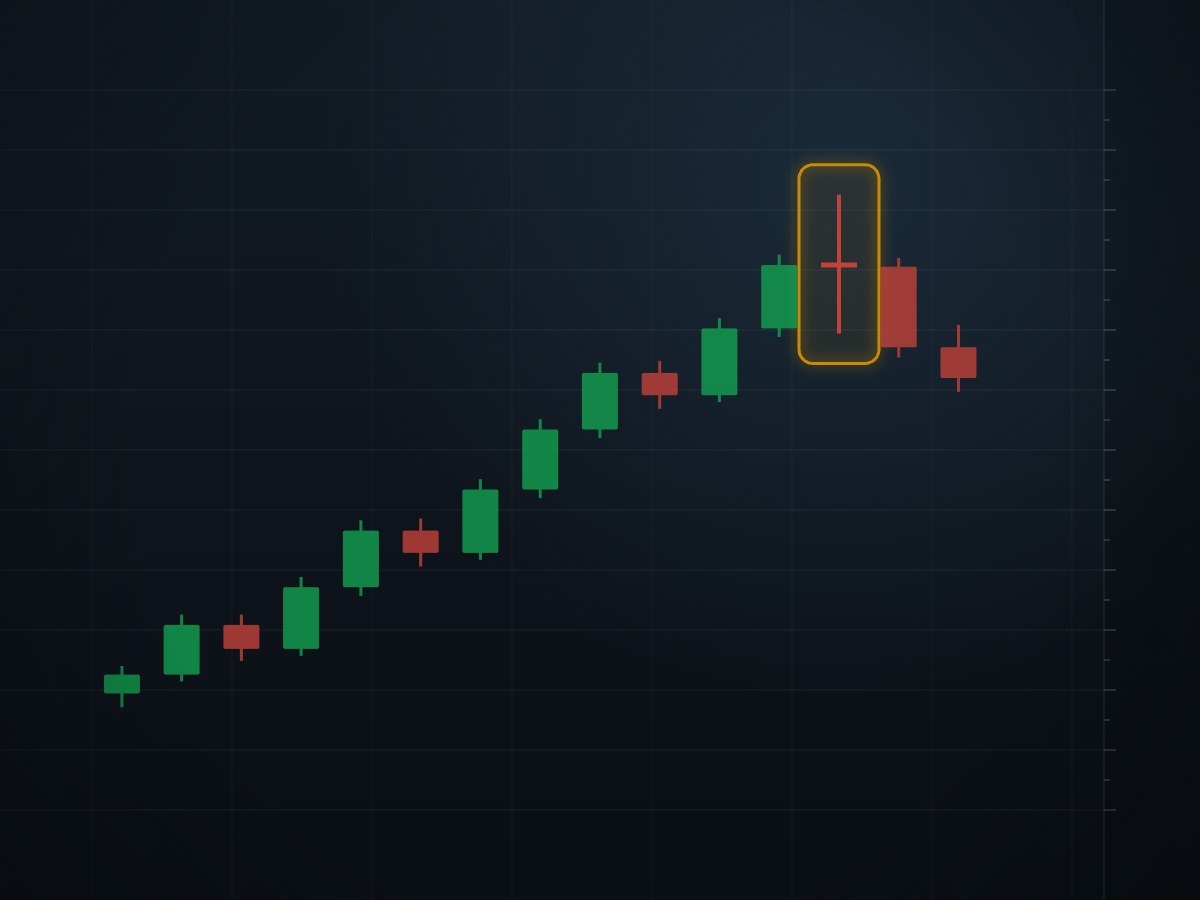 GuideWhat a doji candle tells you, and what it doesn'tThe five kinds of doji drawn to scale, how thin a body has to be to count, what one long-running test found about doji reversals (roughly a coin flip), and the...
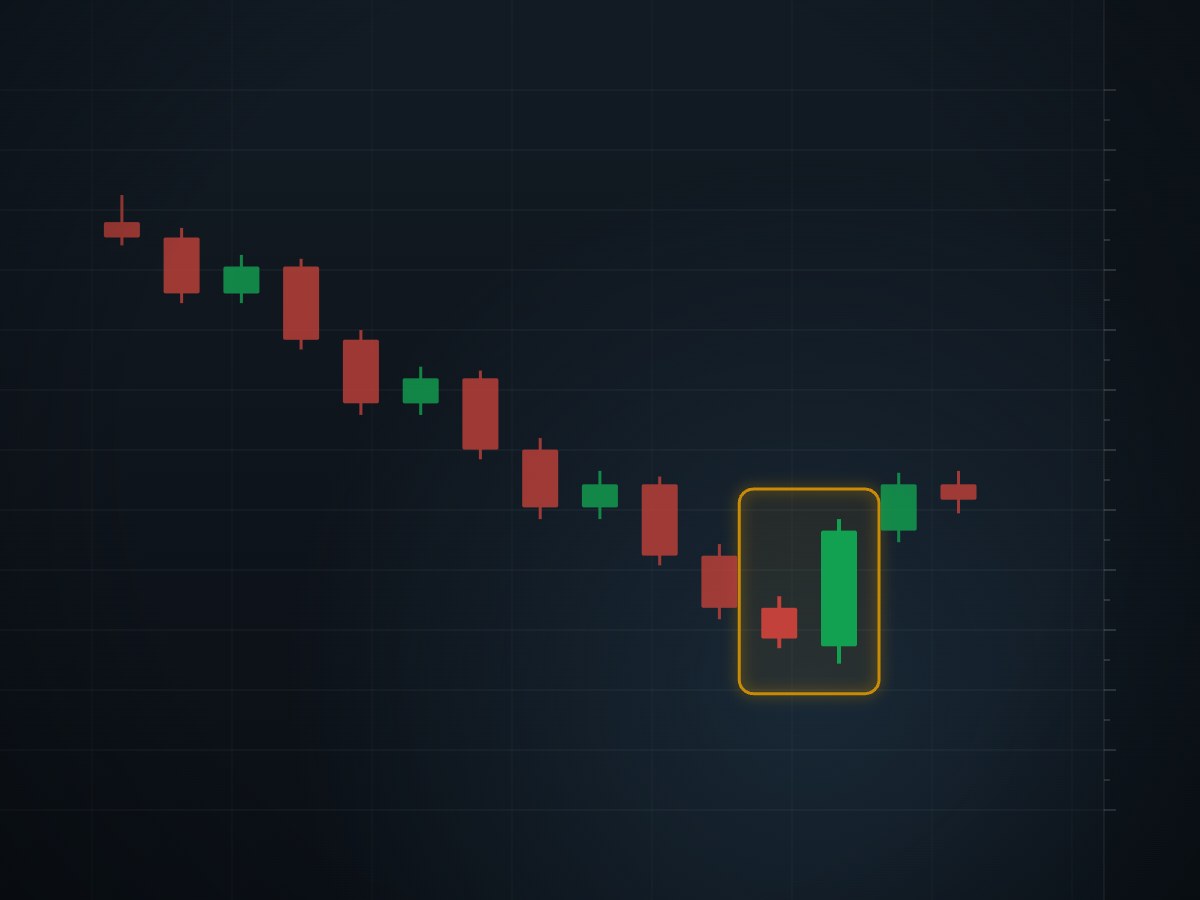 GuideBullish and bearish engulfing candles, and the wick questionTwo candles, the second body swallowing the first. Here is the rule that settles the wick question, a worked example with the entry, stop and target marked...
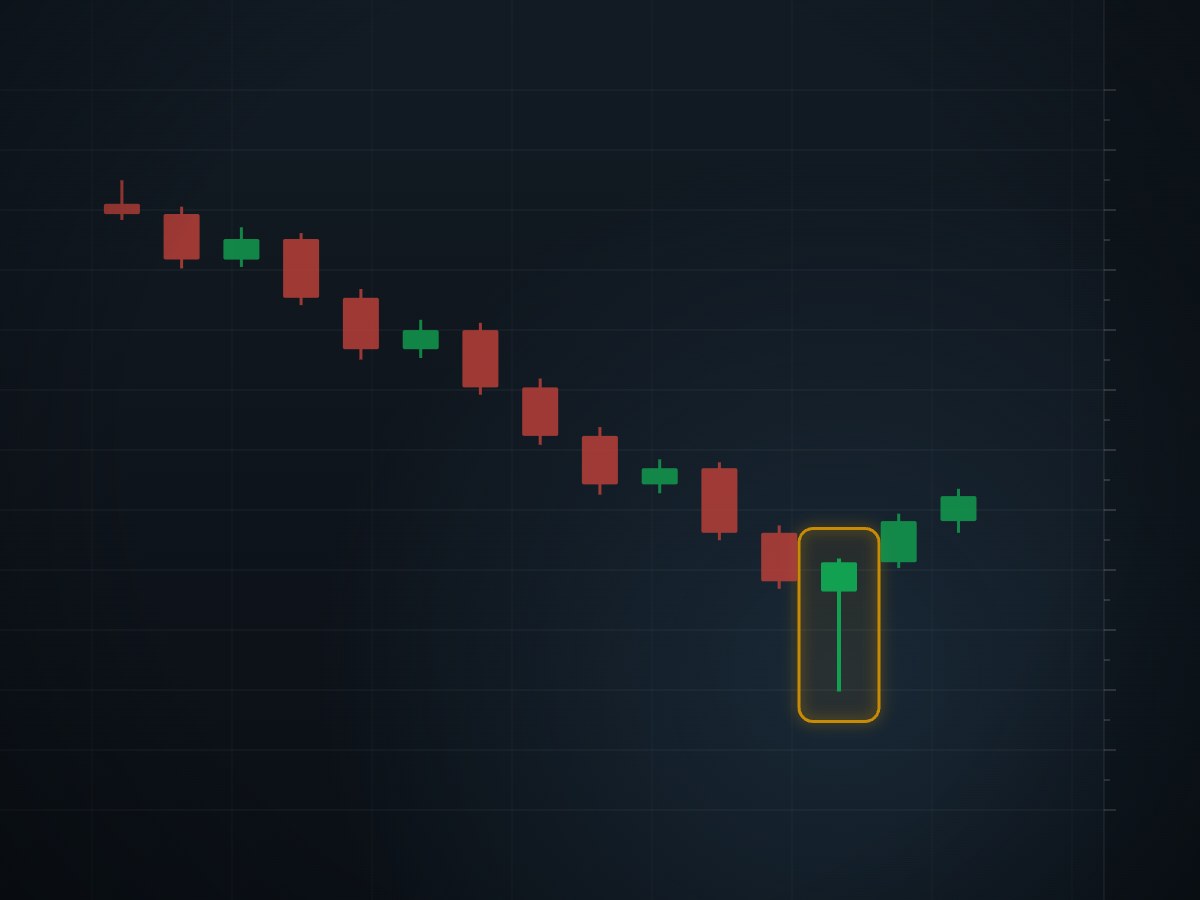 GuideHammer candlestick, and the three candles that look just like itSame shapes, different places on the chart. How to measure a hammer, where traders enter and put the stop, and what the tested numbers say about the hammer...
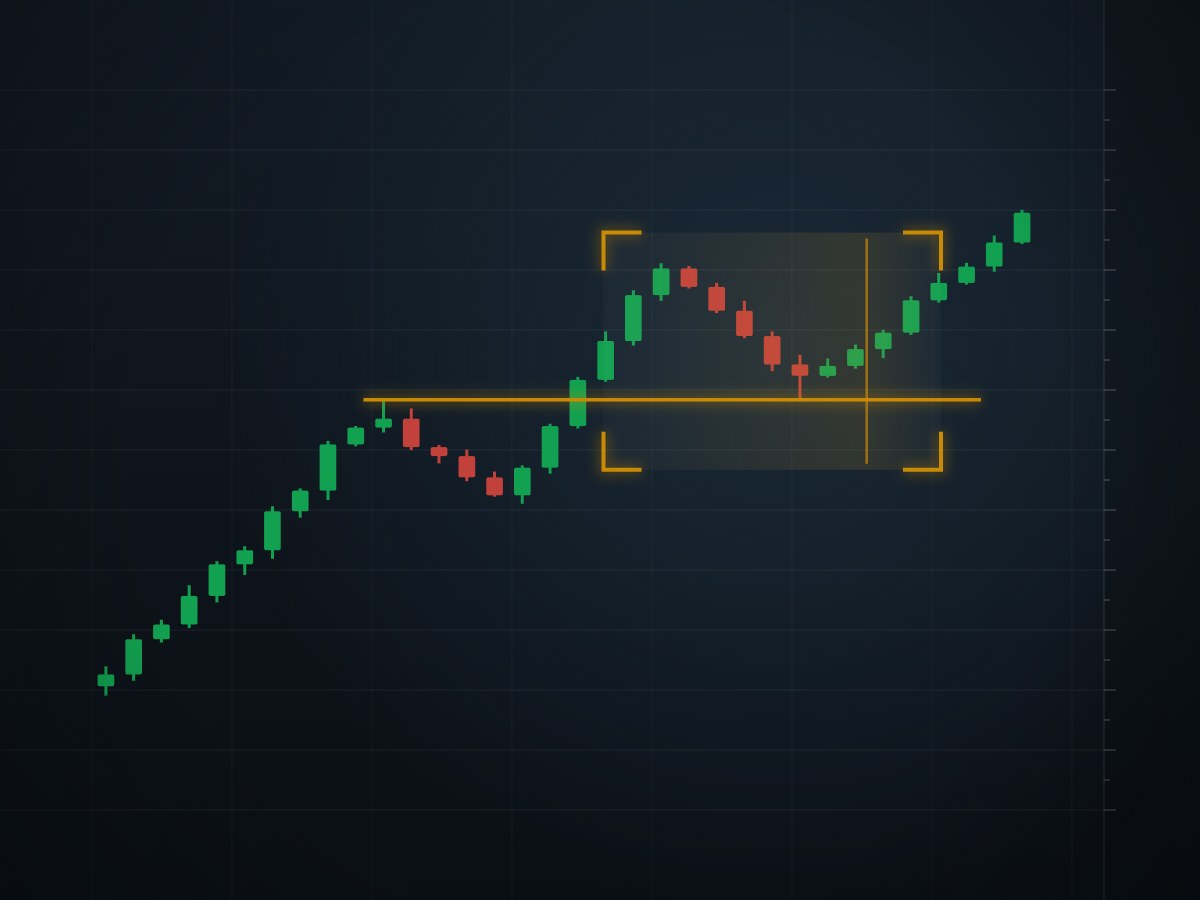
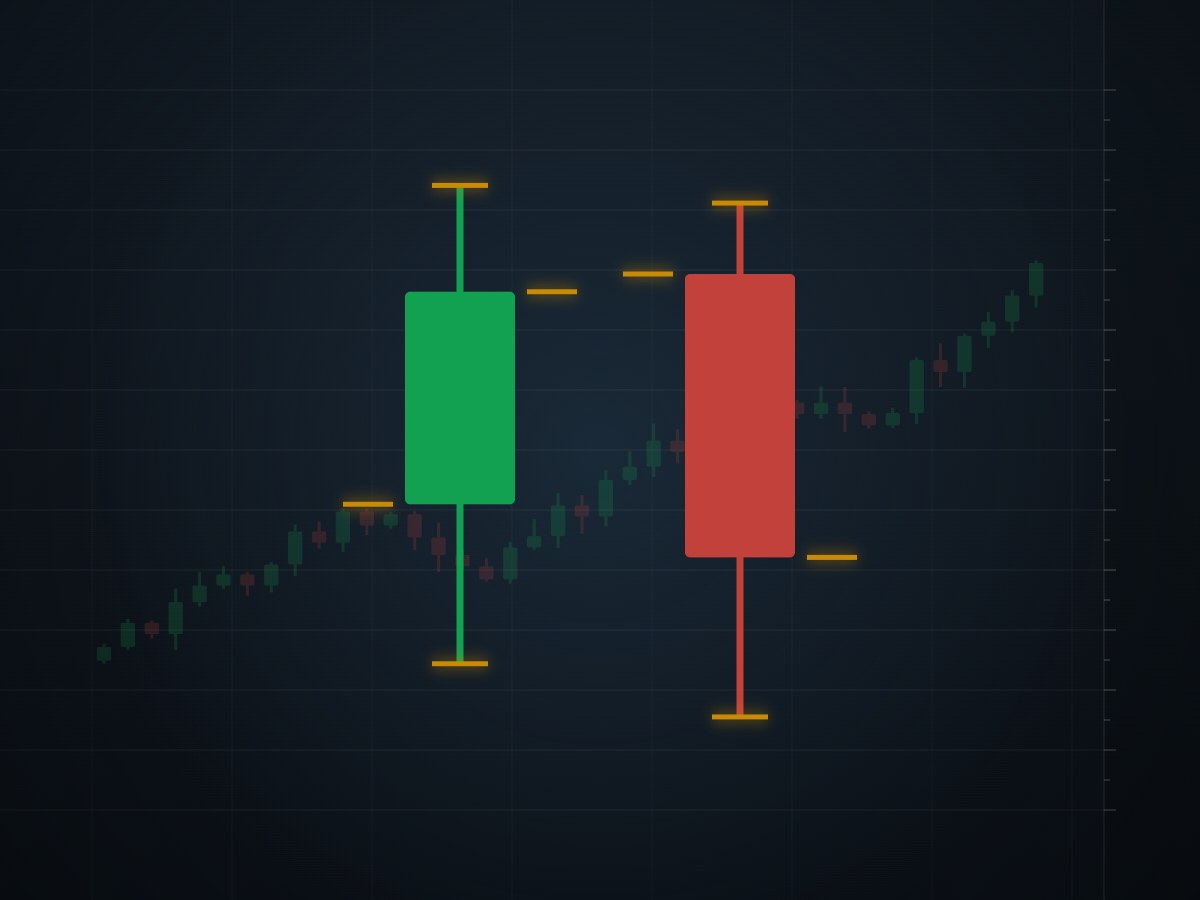 GuideHow to read candlestick chartsEach candle is four prices for one slice of time. Reading the chart means reading those candles together: the trend, the levels, and what the last few did when...
Chart patterns
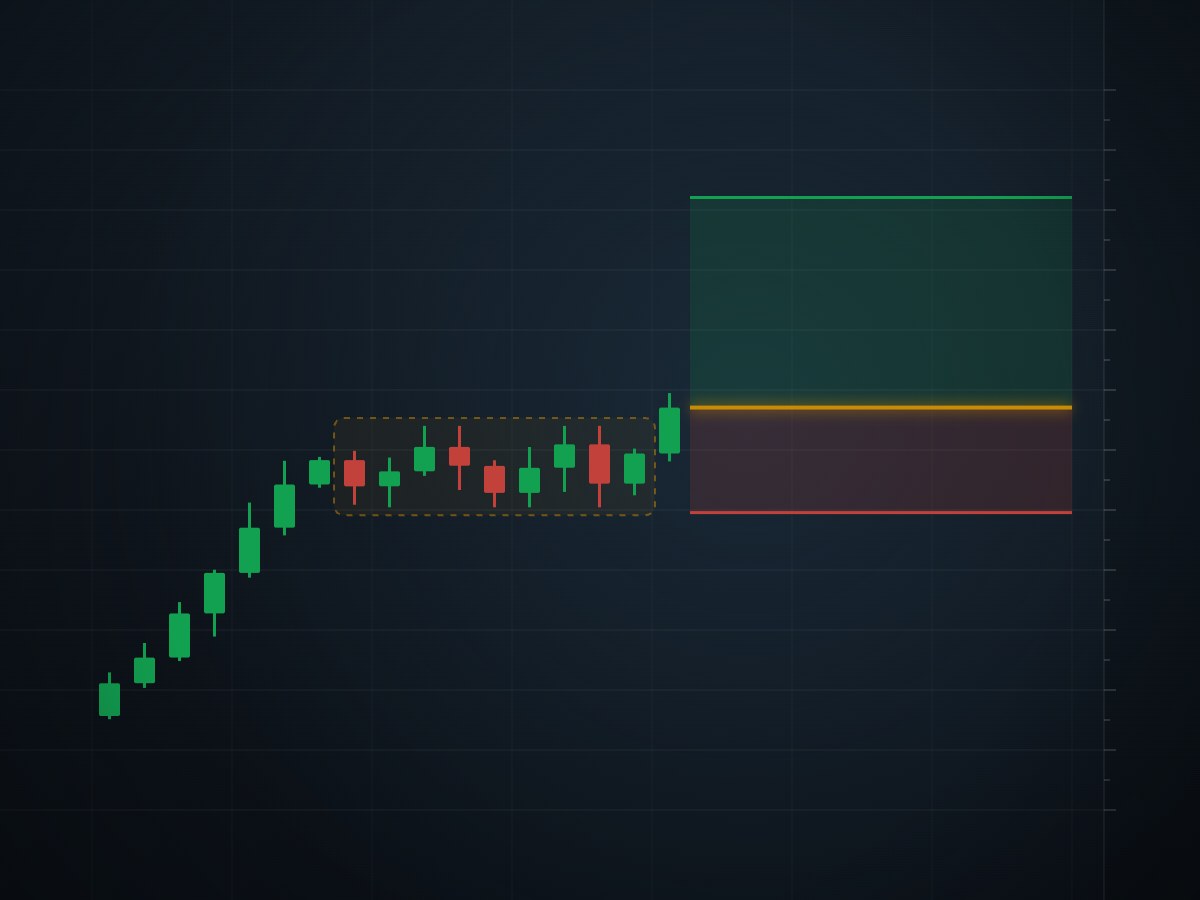
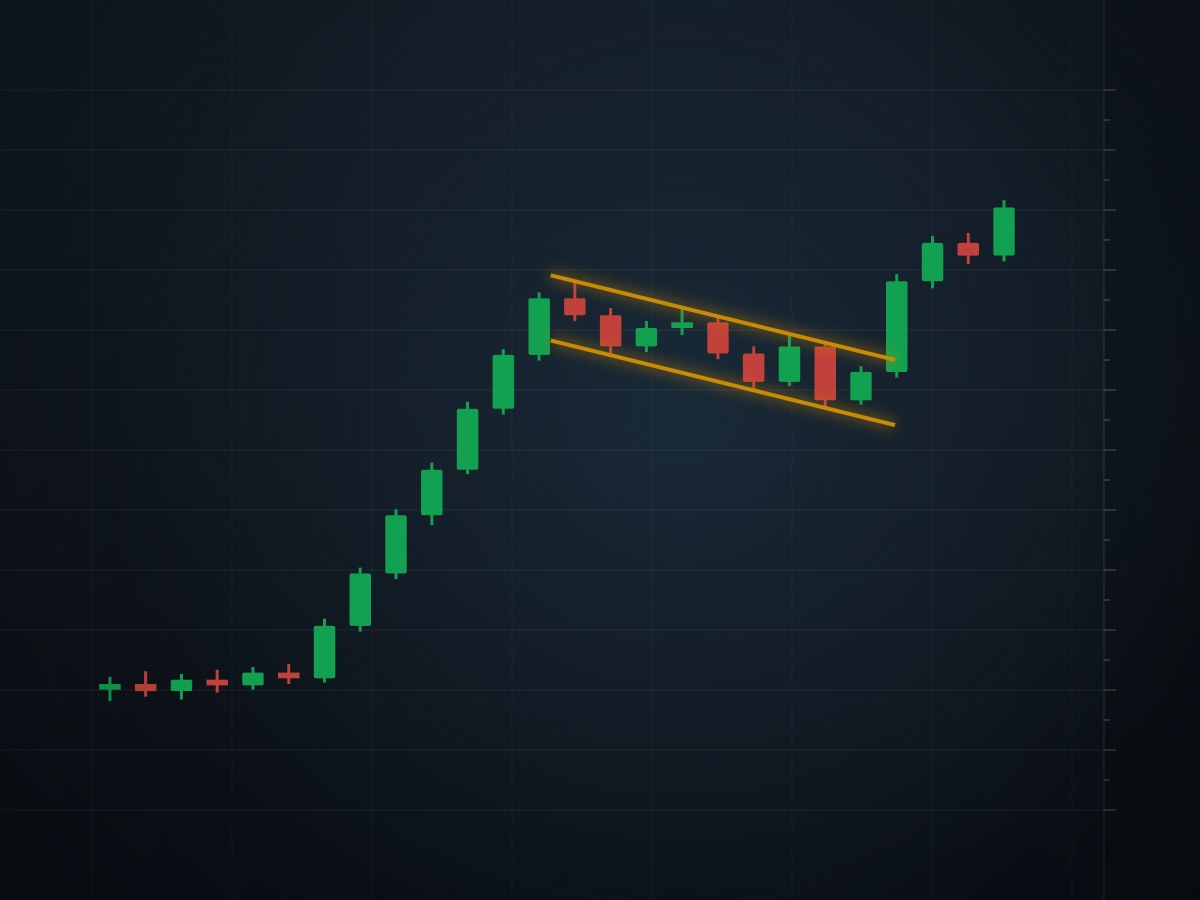 GuideBull flag pattern, from the pole to the stopThe pole, the flag, the breakout and the stop, drawn to scale. Plus the bear flag and the pennant, three ways to measure the target, and the version that traps...
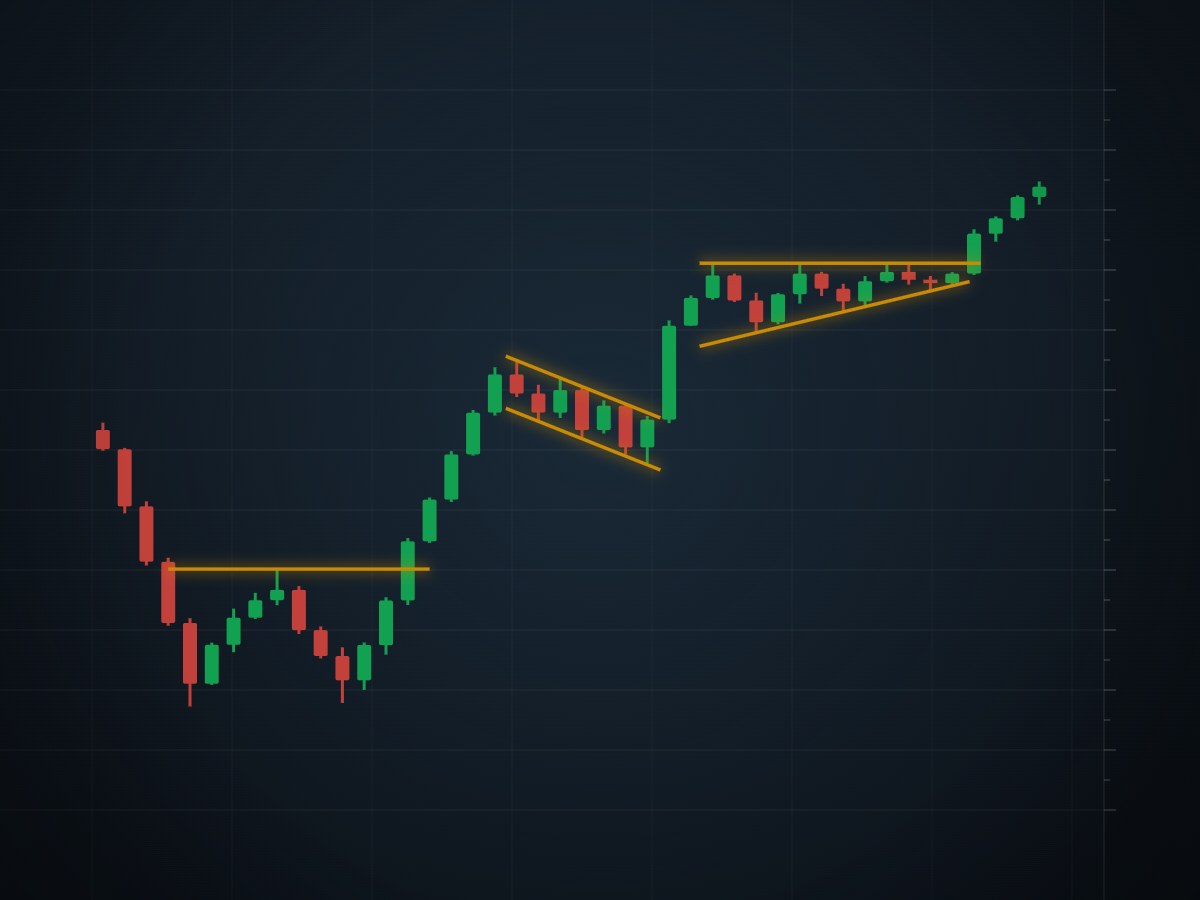 GuideChart patterns, with the stop and target drawn inFourteen patterns grouped by what they usually do: end a trend or pause inside one. Each drawing shows the breakout line, where the pattern is proven wrong and...
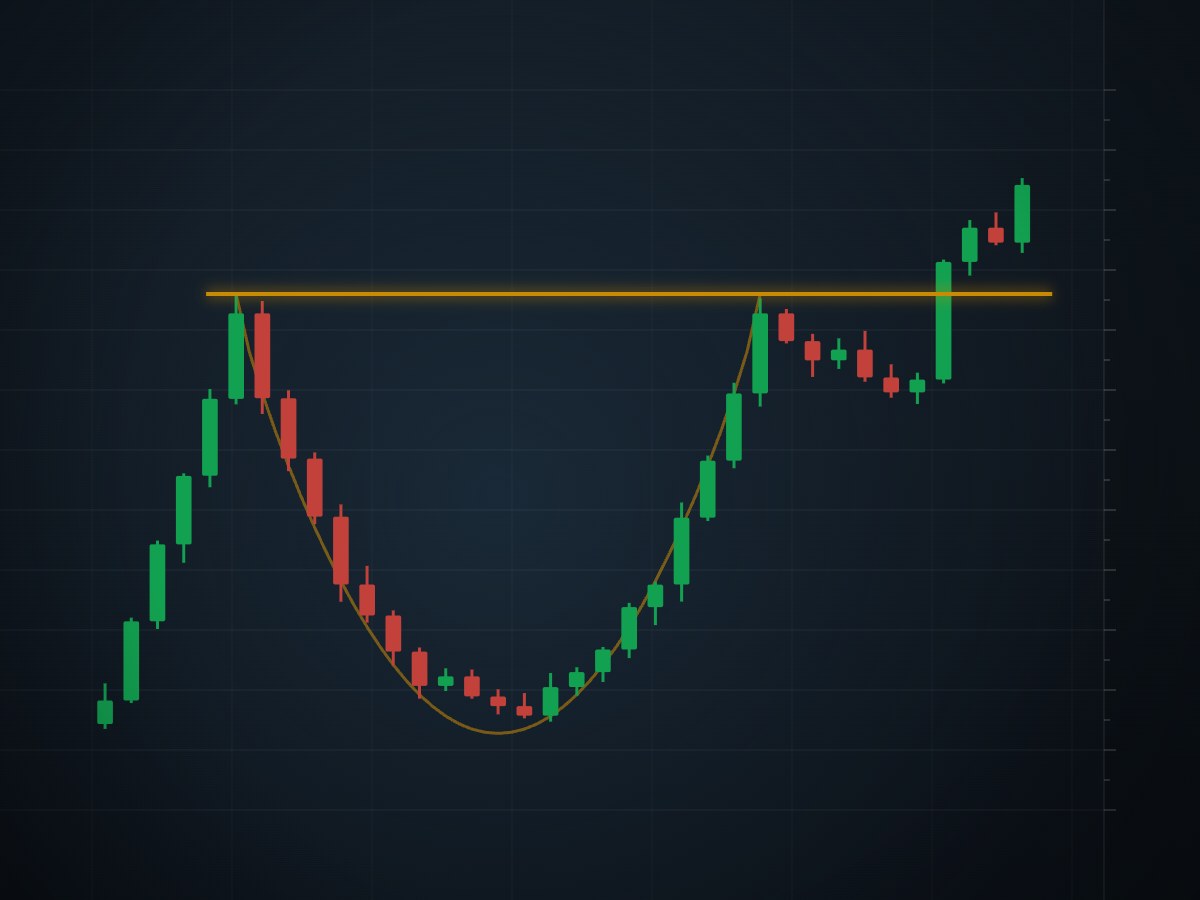 GuideCup and handle patternA rounded bottom, a small drift lower, then a close above the old high. This page draws it, gives the rules with real numbers, works through the target, and...
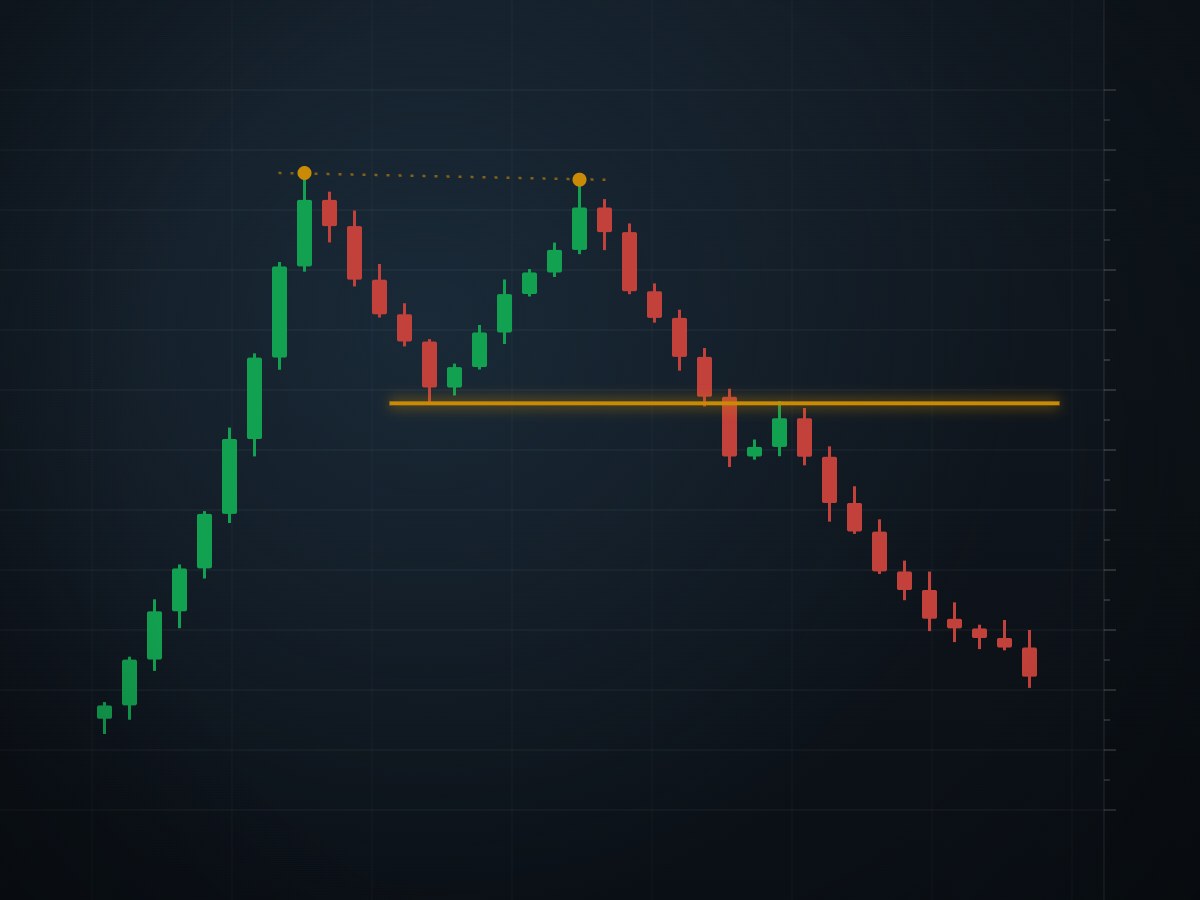 GuideTwo peaks don't make a double top patternA double top is an M-shaped top that confirms only when price closes below the valley. Here are the rules with numbers, the stop and target arithmetic, the...
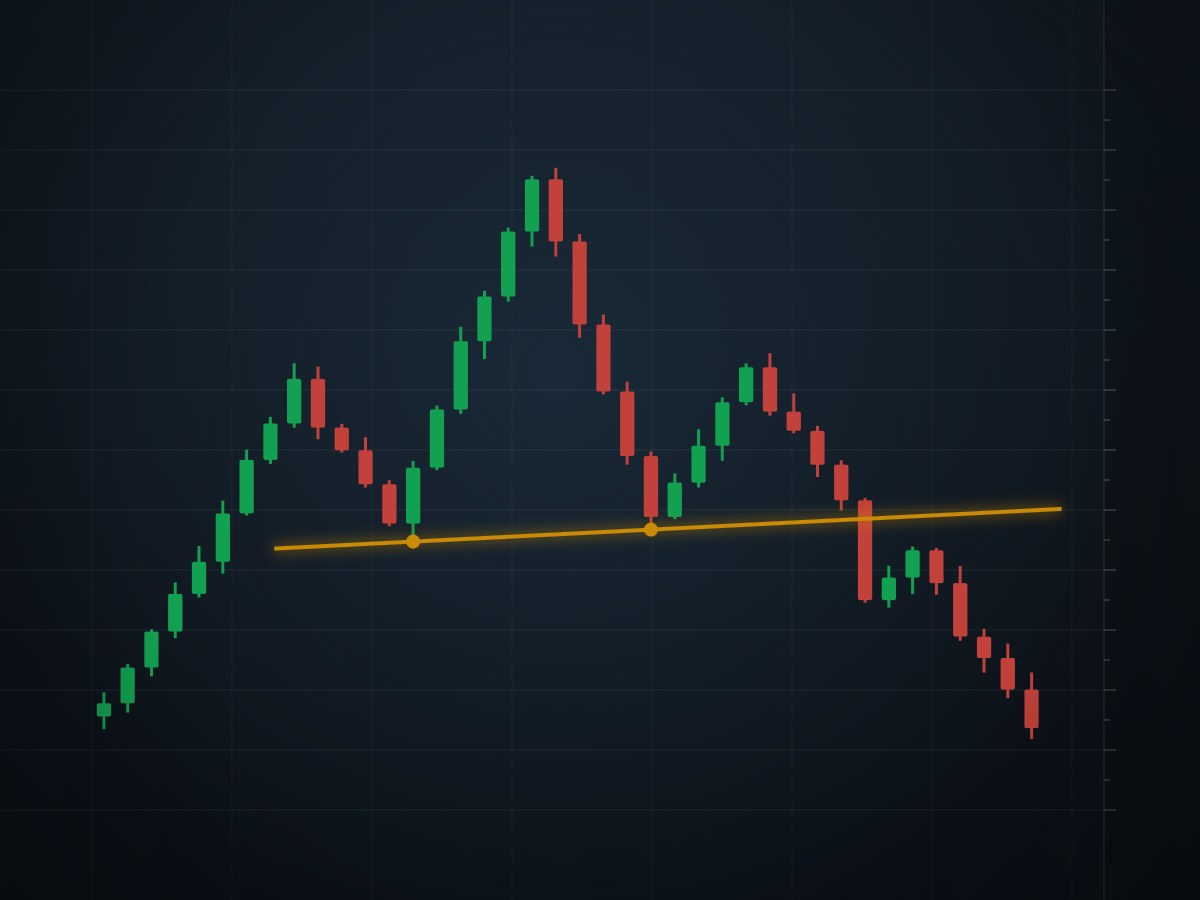 GuideHow to read a head and shoulders patternThree peaks, the middle one highest, and a neckline under them. Here is the pattern drawn to scale, the arithmetic traders use for the stop and the target, and...
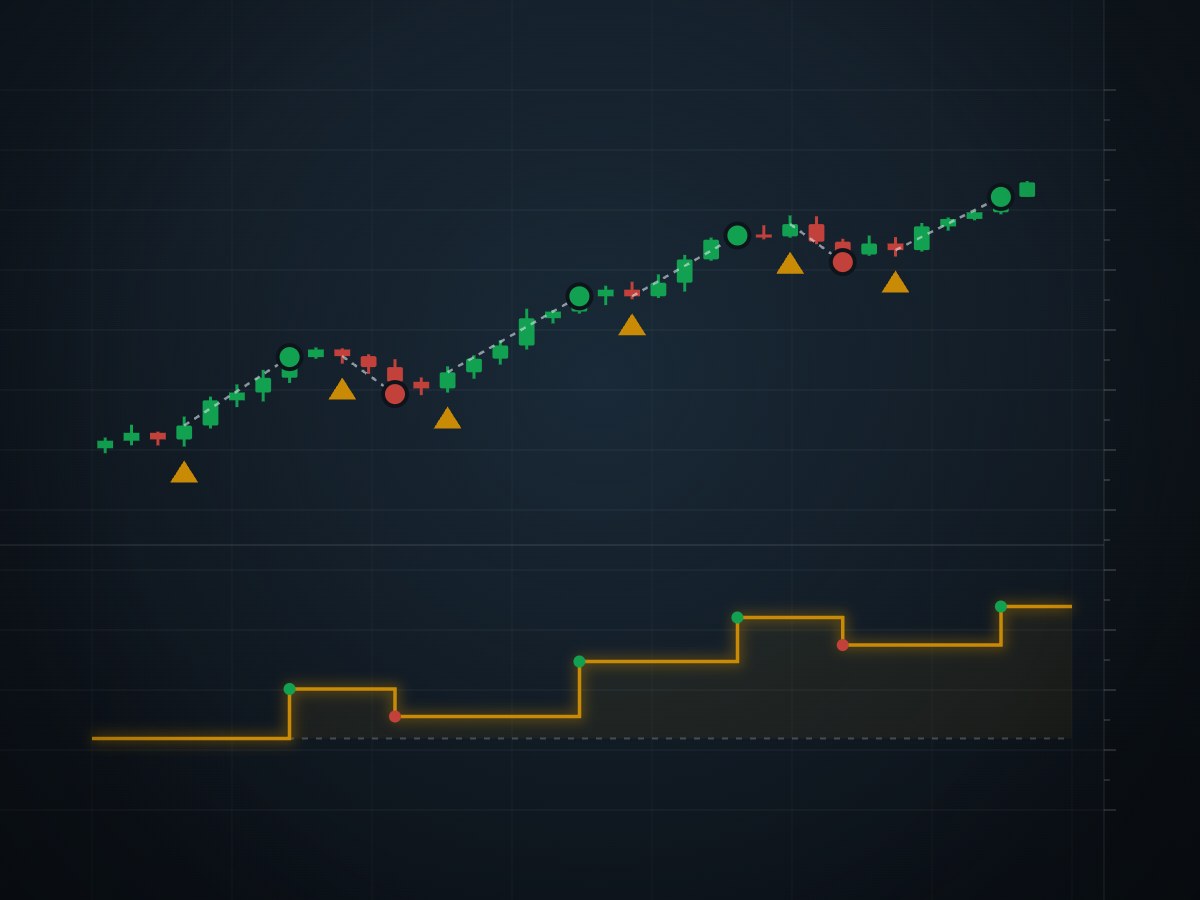
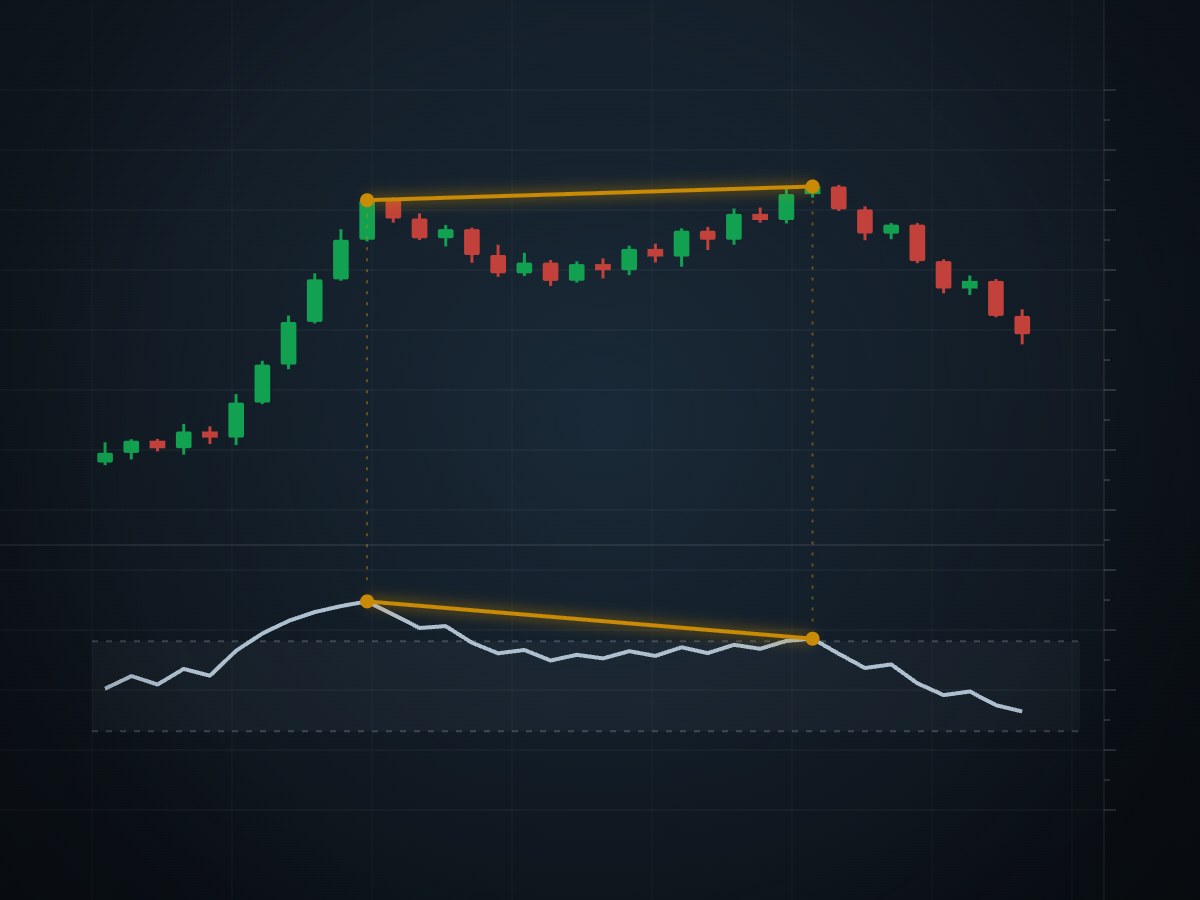 GuideHow to read RSI divergence, and when to ignore itThe worked drawings below use made-up prices with the RSI calculated from them using Wilder's 14-period formula, so the lines are the lines you would really...